
Reducing environmental impact
Peab’s ambition is to take responsibility throughout the entire value chain for the company’s environmental impact. We strive to reduce our climate impact, ensure a highly material effective operation and actively phase out environmental and health hazardous materials.
Lowering carbon dioxide emissions
A major part of society’s energy use and carbon dioxide emissions comes from the construction and civil engineering sector. Global agreements such as UN’s global goals for sustainable development and the agreement from the climate negotiations in Paris 2015 (COP21) point out the direction we need to take. By changing behavior and increasing focus on energy issues we will most certainly be able to make our production more sustainable.
Our ambition is to lower carbon dioxide emissions by reducing total energy consumption and use renewable energy sources whenever possible. Peab’s carbon dioxide emissions primarily come from using fossil fuel in transportation, construction machinery, heating workplaces and manufacturing products. We work hard to use energy as efficiently as possible in these areas in order to lower energy consumption. We also work to successively reduce, and in the long run eliminate, fossil fuel consumption as renewable fuels are being developed.
Some concrete initiatives and results
Good planning is essential to lowering transportation emissions. Logistics are handled in close dialogue with suppliers to lower the impact and emissions of transportation on roads by choosing the right type of vehicle and coordinating loads. We are continuously updating our fleet and in 2016 we bought 30 Volvo Chassis Euro 6 that we intend to fuel with fossil-free diesel.
About 20 percent of the diesel used in Peab during 2016 was diesel with a 20-50 percent mixture of non-fossil fuel. In 2015 we started using a completely fossil-free diesel, HVO 100. The availability of this fuel is limited and we increase the use as possible.
Peab’s ECO-Asfalt®, manufactured based on carbon dioxide neutral bio-oil, represented 59 percent of Peab’s total asphalt manufacturing in Sweden at the end of 2016. Bio-oil is now used at 8 of the 21 asphalt plants in Sweden and reduces carbon dioxide emissions by an estimated 19,600 (6,700) tons annually, compared to the use of traditional fuel oil. Reducing the laying temperature of the asphalt by around 30 degrees cuts energy consumption by an estimated 20 percent and carbon dioxide emissions by 30 percent. In 2016 lower temperature asphalt represented 4.4 (1.9) percent of Peab’s total asphalt laid in Sweden and Norway.
Charting our energy consumption
In accordance with an EU directive Peab started charting energy consumption in 2016. We began with the largest companies in business area Industry, Peab Asfalt and Swerock, representing about 50 percent of the total energy consumption. We continue to chart energy use in the rest of Peab’s operations and will finish by 2020.
Efficient use of material
Construction and civil engineering operations generate large amounts of waste material. Peab aims to have the most material-efficient production possible in all our operations, in part by creating less waste material and in part by taking care of and recycling as much as possible. Material efficient work methods also contribute to reducing carbon dioxide emissions since both manufacturing and waste management of material requires energy.
Waste material in one place can very well be raw material in another. It is therefore crucial to cooperate with other players in the value chain and the industry to create circular flows and more efficient use of materials. It is also essential to create a shared perspective on responsibility and ethical handling of waste material in the industry. In order to lessen the risk that some part in the value chain does not fulfill its responsibility, explicit demands should be integrated into business agreements in combination with continuous onsite controls and follow-up.
Sustainability aspects
- Climate impact
- Resource efficiency
- Phasing out environmental and health hazardous substances
GRI: EN2, EN3, EN6, EN13, EN15, EN16, EN17, EN19, EN23, EN27, CRE8
GC: 7–9
Peab’s environmental objectives
Peab has a great responsibility for reducing our environmental impact throughout the entire value chain. Our work is aimed at:
- Significantly reducing our carbon dioxide emissions.
- Material-efficiency throughout our operations.
- Phasing out environmental and health hazardous substances in production.

Examples of recycling and use of resources
- In Sweden and Norway Peab’s use of recycled material in asphalt manufacturing increased to 13 (12) percent in 2016.
- 20 of Peab’s 42 concrete plants in Sweden manufacture concrete based on ballast with 100 percent crushed rock. Through this we lower our use of the finite resource natural gravel.
- Peab has 20 established units geared towards recycling masses from civil engineering projects.
 Peab’s ECO-Asfalt – a better choice for the environment
Bio-oil is used to dry and heat the gravel material in the manufacture of ECO-Asphalt, which is the part of the process requiring the most energy. The bio-oil is made from vegetable waste material from food production and is classified as carbon dioxide neutral by the Swedish Energy Agency.
The variant ECO-Asfalt plus additionally reduces the temperature of the asphalt by up to 30°C. This achieves a number of sustainable values, such as lower energy consumption and a better working environment since it reduces the amount of smoke gasses and particles. Another environmental gain is that more recycled asphalt is used in the asphalt produced.
Responsible management of waste material
Peab believes that all waste material, regardless of its origin and parts, should be handled in an environmentally correct way following the laws, regulations and industry agreements that are applicable. The largest amount of waste material is created in business area Civil Engineering, particularly in the form of landfill material, and in business area Construction, primarily as mixed and combustible waste and landfill material.
In order to prevent the creation of waste Peab is working on a more precise calculation of the amount of material and masses needed in production. Plaster is a prioritized fraction in the construction operation since recycling more of it means less landfill and recycled material can be used when manufacturing new drywall.
Landfill material is a prioritized area in civil engineering operations. Excess material is classed, depending on how it can be handled, as either waste or a resource. In 2016 Peab developed a method for managing the masses created, received or taken from a site. It helps Peab reduce spreading unwanted substances while increasing the possibility of recycling and re-use of masses.
Re-use and recycling as a business concept
The Recycling segment of Peab’s subsidiary Swerock AB currently has around 20 facilities in Sweden. They work mainly with managing excess material from construction and civil engineering operations, doing everything from handling contaminated masses to using them in construction for civil engineering purposes. Recycling also handles other construction and demolition waste, provides equipment for water purification and manages a construction logistics center together with other players in the Peab Group. Recycling’s business concept can be summed up in: “We contribute to sustainable construction by preventing the generation of waste as well as through recycling and re-using by coordinating the unique competences in the Group.”
Production free from environmental and health hazardous materials
The products used in production, groundwork, reconstruction and maintenance are of great importance because of the impact they have on the environment. Unfortunately, the construction and civil engineering industry still uses environmental and health hazardous materials and new ones are continuously being released on the market. Peab’s ambition is to, as far as possible, phase out environmentally and health hazardous materials with the help of manufacturers, suppliers, industry colleagues and customers by focusing on using the right material and traceability.
The importance of choosing the right material from the start
Peab works doggedly on selection of the right material and traceability. Traceability is important since there might be substances that today are not considered hazardous or have not yet been investigated but in the future might prove to have an impact on humans and nature. If there are no alternatives and Peab needs to use products with less suitable elements these need to be traceable. The choice of material in Peab’s Swedish construction and civil engineering operations is based on two systems: BASTA and Byggvarubedömningen (Building Material Assessment System).
Chemical products in the Swedish civil engineering and industry operations have been inventoried and the information registered in the chemical management system iChemistry. This is now being followed up by risk assessments and phase outs of dangerous chemical products. Materials used in construction operations are being registered in Byggvarubedömningen to identify products and materials that contain environmental and health hazardous substances. This allows us to identify where, and to what extent, products and materials that contain environmental and health hazardous substances are used. At the same time we are working together with suppliers to replace environmental and health hazardous substances used extensively.
Environmental certification of buildings

The diagram shows the number of projects that are certified or where certification is ongoing. Ongoing means that registration has been made with the responsible certification organ during the current year or previously, and certification is in the pipeline. Certified refers to received certifications that has been received. The preliminary certifications are shown for Miljöbyggnad and BREEAM. The statistics include Peab’s own in-house projects where Peab is responsible for certification and projects Peab is building for a customer.


Steering environmental work
Environmental work takes place on all levels and is an integrated part of Peab. Since all the business areas share and are affected by many of the same issues they are coordinated on Group level.
In turn, the business areas are responsible for implementing measures in daily work and for creating processes and action plans that step-by-step help us achieve our environmental goals.
Each business area has resources on business area, company and regional levels that support environmental work in daily operations.
Peab’s environmental management system is an integral part of the business management system. The environment policy is integrated into Peab’s company policy and is in harmony with the code of conduct, which is based on the principles of the UN Global Compact including the precautionary principle. The environment policy satisfies all of the requirements for ISO 14001:2004, and large parts of Peab’s business are now certified in accordance with ISO 14001 or other certification systems.

Environmental certification is an important verification
There are many reasons why it is important to construct and develop buildings with environmental certifications. A certification is a verification from a third party that we work constructively with environmental issues and generate results. An environmentally certified building also has an added sales and acquisition value and a certification is an excellent way of displaying a building’s environmental properties.
Peab works with environmental certification for buildings and infrastructure to satisfy our customers and in our own projects. Peab’s organization has competence in the certifications BREEAM, LEED, the Swan, Green Building, Miljöbyggnad, Well Building Standard and CEEQUAL.
Goal for construction waste
- At least 87 percent sorted before leaving the site and no more than eight percent goes to landfill.
Result 2016: 79 percent sorted, seven percent landfill.

Waste
Business area Construction, 49,802 tons

Business area Civil Engineering, 72,057 tons

Processing method per fraction
| Fraction | Landfill (%) | Incineration (%) | Recycling (%) |
| Mixed waste | 14 | 76 | 10 |
| Landfill material | 27 | 73 | |
| Burnable | 100 | ||
| Wood | 100 | ||
| Scrap and metal | 100 | ||
| Landfill | 100 | ||
| Drywall | 50 | 50 | |
| Sledge | 50 | 50 | |
| Hazardous waste | 50 | 50 | |
| Paper | 100 |
The statistics cover Swedish operations and are limited to the waste handled by Peab’s main waste management partners. The bar diagram shows the amount of waste, sorted into fractions, from business areas Construction and Civil Engineering. The table shows how the sorted fractions are then handled by Peab’s main waste management partners.
CO2 emissons
| tons CO2 | 2016 | 2015 | 2014 |
| Scope 1 | |||
| Fuel oil | 15,743 | 23,248 | 26,986 |
| Gasoline | 677 | 758 | 756 |
| Diesel | 44,183 | 45,283 | 83,216 |
| Diesel with non-fossil blends | 39,442 | 37,087 | 10,120 |
| Scope 2 | |||
| Electricity | 935 | 945 | 1 056 |
| Scope 3 | |||
| Waste management incl. waste transportation | 44,759 | 152,483 | 25,718 |
| Business trips air travel | 1,723 | 1,118 |
The chart shows carbon dioxide emissions (CO2) for Peab’s Swedish business. Emissions from fuel have been calculated with the aid of the GHG Protocol. CO2 calculations of electricity use are based on EPD from a main supplier. CO2 for waste has been calculated with a tool developed by the industry. Business trips include air travel booked via Peab’s travel agent and CO2 information for air travel is produced according to the STS Standard.
Energy use
| GWh | 2016 | 2015 | 2014 |
| Electricity | 96,578 | 97,623 | 109,053 |
| Fuel oil | 58,890 | 86,963 | 95,703 |
| Non-fossil fuel oil | 83,552 | 28,718 | 12,480 |
| Gasoline | 2,701 | 3,079 | 3,127 |
| Ethanol | 133 | 200 | 267 |
| Diesel | 170,472 | 174,714 | 315,677 |
| Diesel 5–7% FAME | 111,366 | 27,980 | 22,454 |
| Diesel 10–50% FAME | 90,820 | 144,100 | 18,824 |
| HVO100 | 771 | 22 |
The statistics include energy use in Swedish operations. Electricity is limited to the electricity purchased from a main supplier. The electricity is environmentally declared and corresponds to an estimated 50 percent of the purchased volume of electricity in Sweden. Statistics for fuel are based on the number of purchased liters. The energy content (GWh) is for 2015 and calculated with the aid of conversion factors from the Swedish Petroleum and Biofuels Institute (SPBI) along with specifications from fuel suppliers.
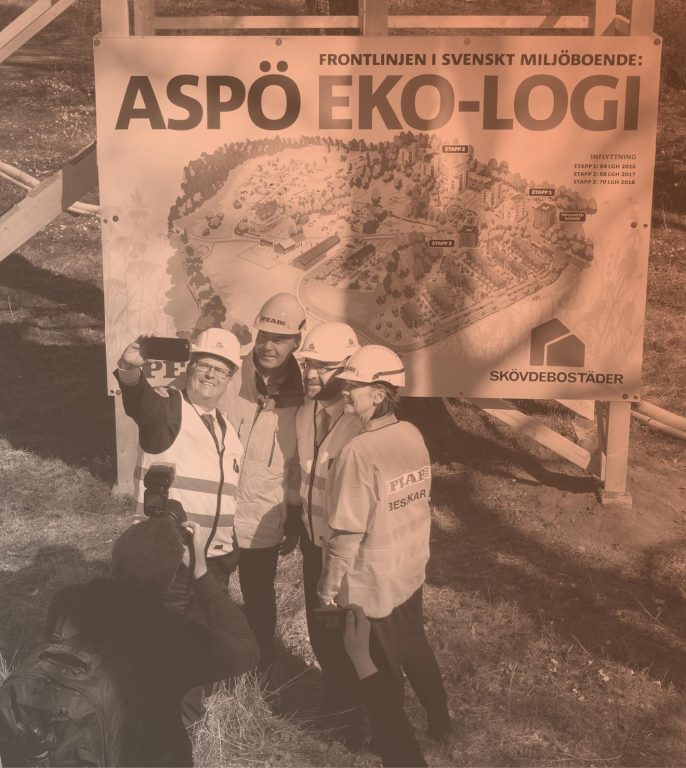 Forward-looking neighborhood with a strong environmental profile
The neighborhood Aspö Eko-logi in Skövde, with a total of 242 apartments, will be designed in harmony with nature and have an explicit ecological profile. The idea is to combine no less than three environmental and energy certifications: the Passive House Standard FEBY12, Swan environmental certification and Miljöbyggnad Guld. The building facades will be made primarily from natural materials and the plans also include solar energy panels that will produce warm water and electricity, recycling household stormwater for watering vegetable gardens and a charging station, in preparation for an electric car carpool.
The first tenants moved in during 2016 and the entire Aspö Eko-logi project will be completed in 2018.